Observability
For deploying a complete observability stack on Kubernetes we recommend:
- Kube-Prometheus-Stack: Includes Prometheus, Grafana, AlertManager, Prometheus Operator, Node Exporter, and Kube-State-Metrics
- Loki: Log aggregation system designed for efficiency and cost-effectiveness
- Promtail: Agent for collecting and forwarding logs to Loki
| Component | Purpose |
|---|---|
| Prometheus | Collects and stores metrics as time-series data |
| Grafana | Visualizes metrics and logs through customizable dashboards |
| AlertManager | Manages and routes alerts based on defined rules |
| Prometheus Operator | Manages Prometheus instances using Kubernetes CRDs |
| Node Exporter | Collects hardware and OS-level metrics from cluster nodes |
| Kube-State-Metrics | Exposes Kubernetes object state metrics |
| Loki | Aggregates and indexes logs efficiently |
| Promtail | Collects logs from pods and forwards them to Loki |
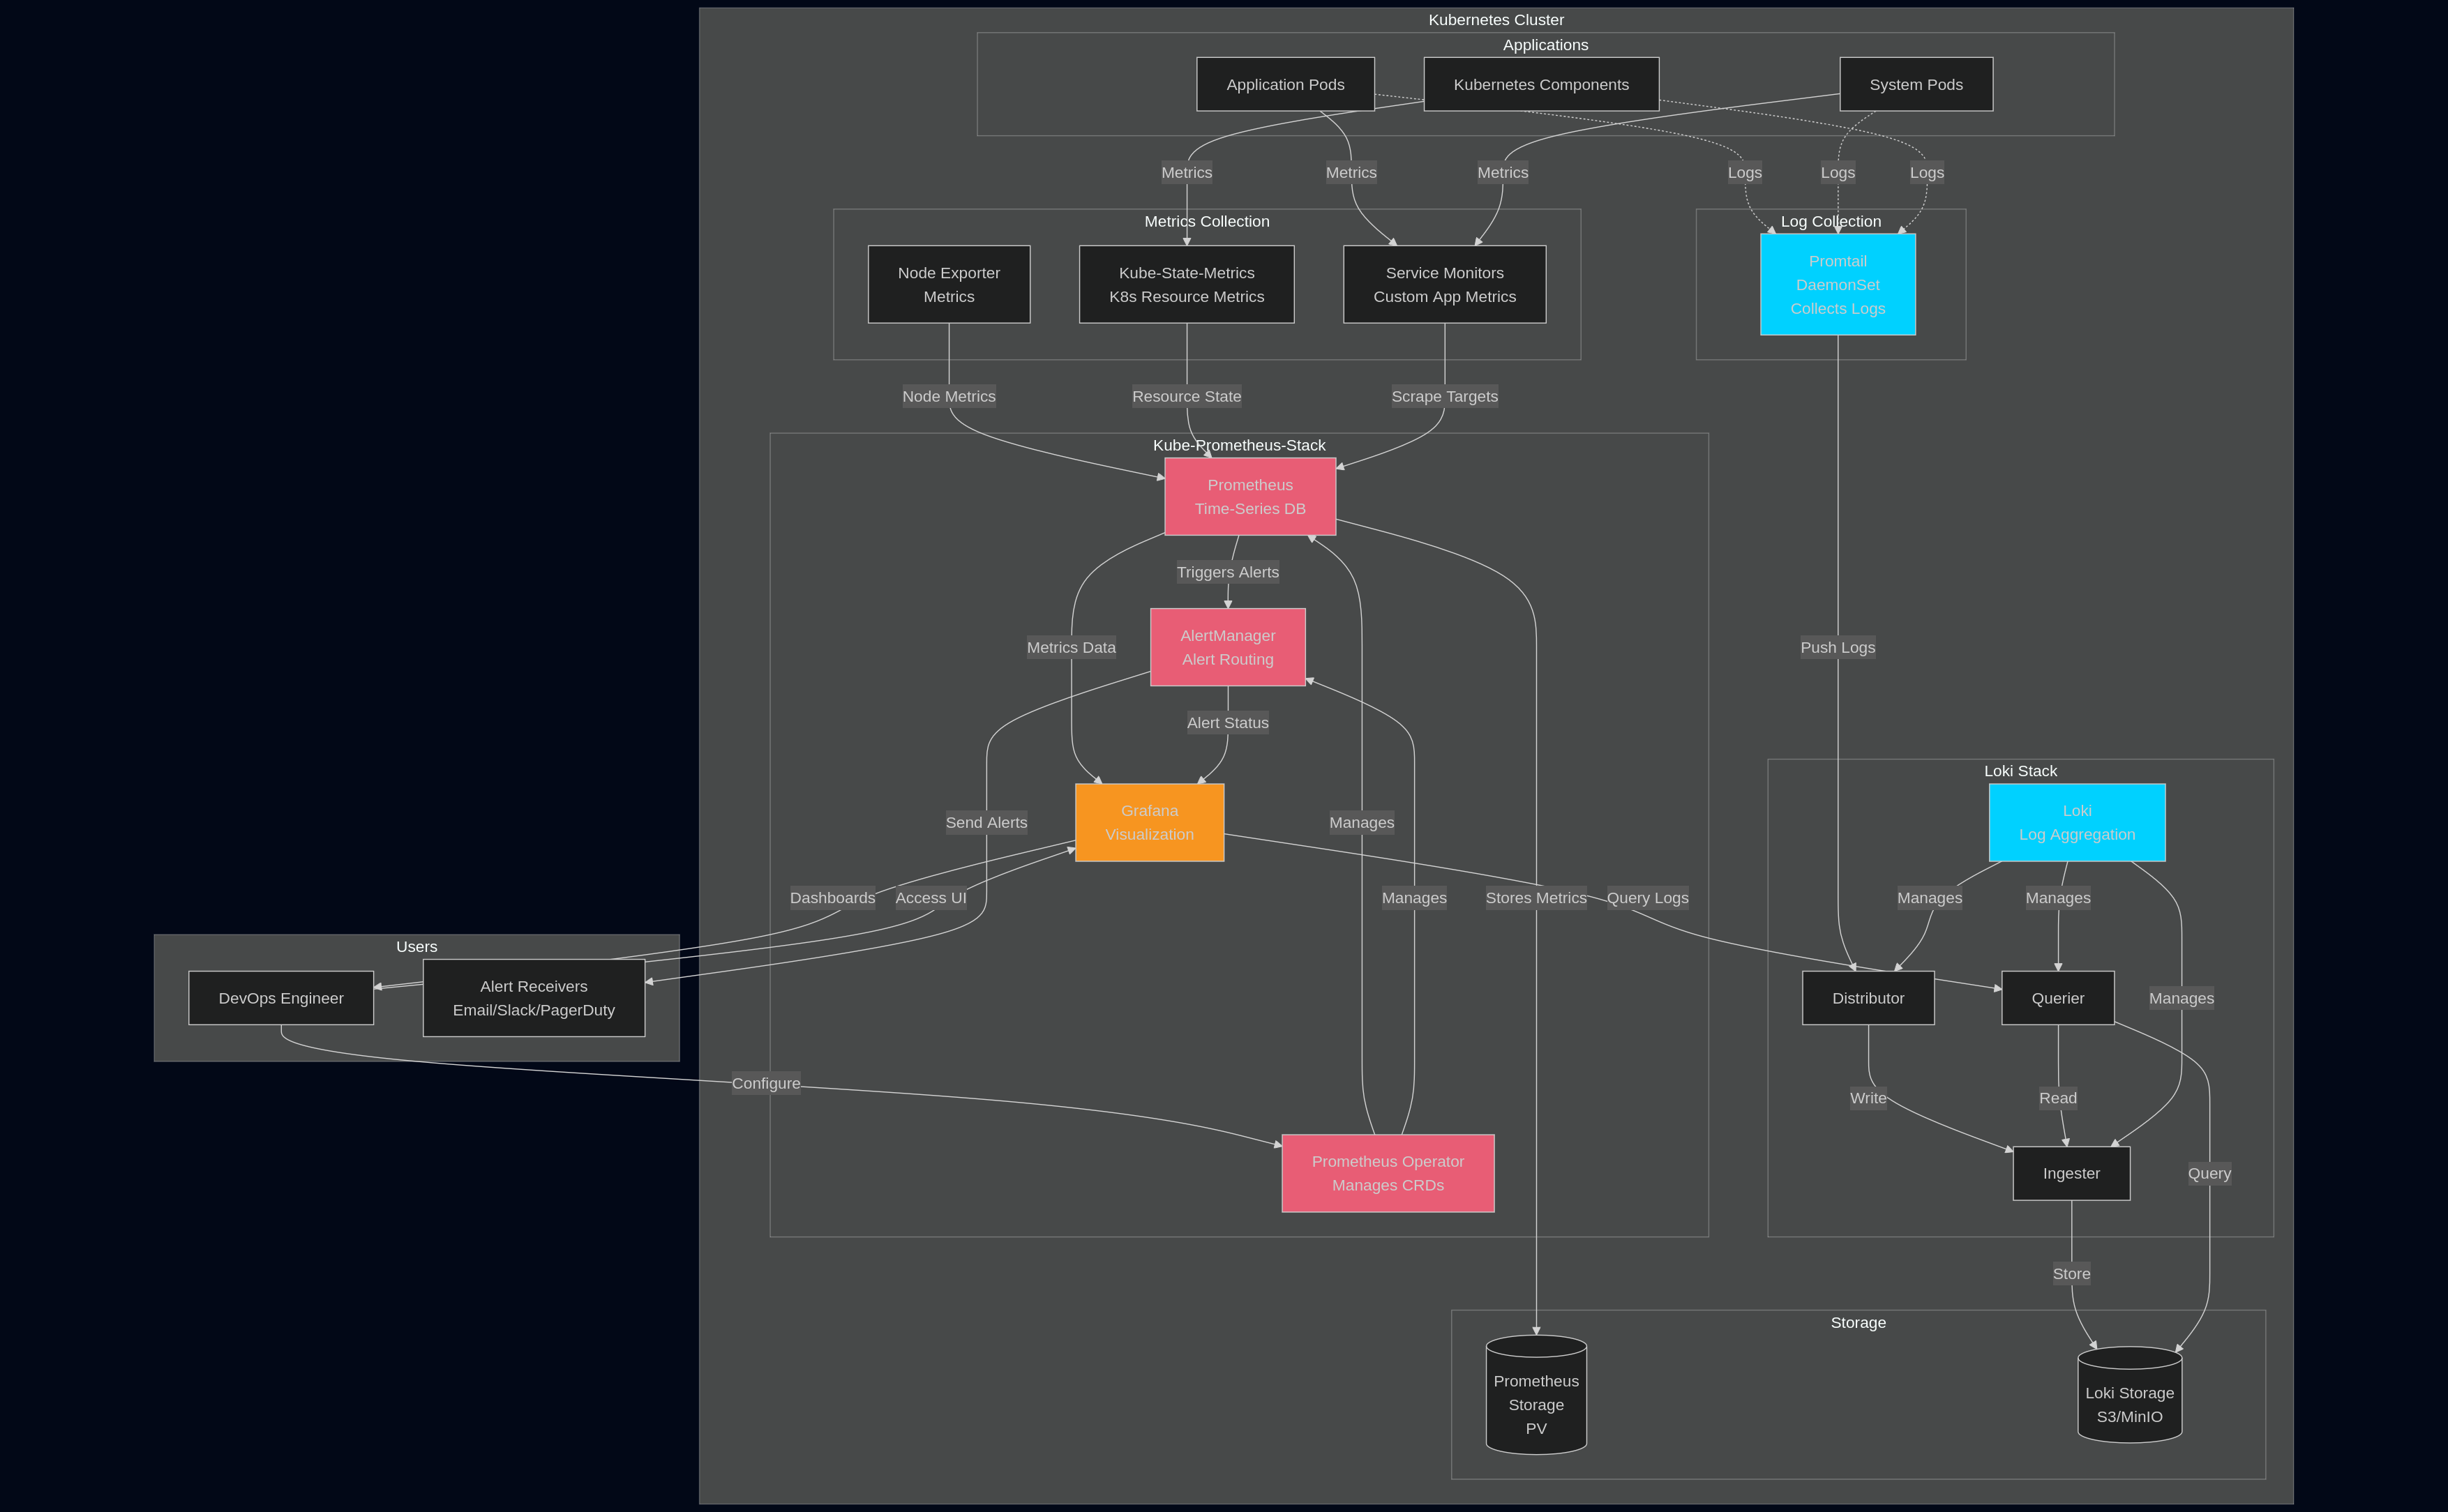
The monitoring stack follows this data flow:
- Metrics Collection: Node Exporter, Kube-State-Metrics, and Service Monitors collect metrics
- Metrics Storage: Prometheus scrapes and stores metrics in its time-series database
- Log Collection: Promtail (DaemonSet) collects logs from all pods
- Log Storage: Loki receives, indexes, and stores logs
- Visualization: Grafana queries both Prometheus and Loki for unified dashboards
- Alerting: Prometheus evaluates rules and sends alerts to AlertManager
Installation
Step 1: Add Helm Repositories
Make sure kubeconfig is obtained from portal and active in current shell via KUBECONFIG environment variable or specified via --kubeconfig flag for helm and kubectl command line tools.
# Add Prometheus Community repository
helm repo add prometheus-community https://prometheus-community.github.io/helm-charts

# Add Grafana repository
helm repo add grafana https://grafana.github.io/helm-charts

# Update repositories
helm repo update
Step 2: Create Monitoring Namespace
kubectl create namespace monitoring
Step 3: Install Kube-Prometheus-Stack
Quick Installation (Default Settings)
helm install kube-prom-stack prometheus-community/kube-prometheus-stack \
  --namespace monitoring
Example Production Installation
Create a prometheus-values.yaml file:
# prometheus-values.yaml
global:
  rbac:
    create: true

prometheus:
  prometheusSpec:
    replicas: 2
    retention: 15d
    retentionSize: "45GB"

    # Storage configuration
    storageSpec:
      volumeClaimTemplate:
        spec:
          storageClassName: "fast"
          accessModes: ["ReadWriteOnce"]
          resources:
            requests:
              storage: 50Gi

    # Resource limits
    resources:
      requests:
        memory: 2Gi
        cpu: 1
      limits:
        memory: 4Gi
        cpu: 2

    # Enable ServiceMonitor discovery across all namespaces
    serviceMonitorSelectorNilUsesHelmValues: false
    serviceMonitorSelector: {}
    serviceMonitorNamespaceSelector: {}

alertmanager:
  alertmanagerSpec:
    replicas: 3
    storage:
      volumeClaimTemplate:
        spec:
          storageClassName: "fast"
          accessModes: ["ReadWriteOnce"]
          resources:
            requests:
              storage: 10Gi

grafana:
  enabled: true
  adminPassword: "ChangeMeStrongPassword"

  # Persistence for Grafana
  persistence:
    enabled: true
    storageClassName: "fast"
    size: 10Gi

  # Ingress configuration (optional)
  ingress:
    enabled: true
    annotations:
      kubernetes.io/ingress.class: nginx
      cert-manager.io/cluster-issuer: letsencrypt-prod
    hosts:
      - grafana.yourdomain.com
    tls:
      - secretName: grafana-tls
        hosts:
          - grafana.yourdomain.com

  # Additional data sources will be added later
  sidecar:
    datasources:
      enabled: true
      defaultDatasourceEnabled: true

# Node Exporter configuration
nodeExporter:
  enabled: true

# Kube-State-Metrics configuration
kubeStateMetrics:
  enabled: true
Install with custom values:
helm install kube-prom-stack prometheus-community/kube-prometheus-stack \
  --namespace monitoring \
  -f prometheus-values.yaml
Step 4: Install Loki
Create a loki-values.yaml file:
S3 Storage
The example configuration below makes use of S3 storage.
# loki-values.yaml
loki:
  commonConfig:
    replication_factor: 1

  schemaConfig:
    configs:
      - from: "2024-04-01"
        store: tsdb
        object_store: s3
        schema: v13
        index:
          prefix: loki_index_
          period: 24h

  ingester:
    chunk_encoding: snappy

  querier:
    max_concurrent: 4

  pattern_ingester:
    enabled: true

  limits_config:
    allow_structured_metadata: true
    volume_enabled: true
    retention_period: 672h  # 28 days

  storage:
    type: s3

# Deployment mode
deploymentMode: SimpleScalable

# Backend replicas
backend:
  replicas: 2

# Read replicas
read:
  replicas: 2

# Write replicas
write:
  replicas: 3

# Enable MinIO for storage (for testing/development)
minio:
  enabled: true

# Disable for production and use cloud storage instead
# For AWS S3:
# loki:
#   storage_config:
#     aws:
#       region: us-east-1
#       bucketnames: my-loki-bucket
#       s3forcepathstyle: false
Install Loki:
helm install loki grafana/loki \
  --namespace monitoring \
  -f loki-values.yaml
Step 5: Install Promtail
Create a promtail-values.yaml file:
# promtail-values.yaml
config:
  # Point to Loki service
  clients:
    - url: http://loki-gateway/loki/api/v1/push

  snippets:
    pipelineStages:
      - cri: {}
      - regex:
          expression: '.*level=(?P<level>[a-zA-Z]+).*'
      - labels:
          level:

# Resource limits
resources:
  requests:
    cpu: 100m
    memory: 128Mi
  limits:
    cpu: 200m
    memory: 256Mi
Install Promtail:
helm install promtail grafana/promtail \
  --namespace monitoring \
  -f promtail-values.yaml
Step 6: Verify Installation
# Check all pods in monitoring namespace
kubectl get pods -n monitoring

# You should see pods for:
# - prometheus-operated
# - alertmanager
# - grafana
# - kube-state-metrics
# - node-exporter (one per node)
# - prometheus-operator
# - loki (backend, read, write)
# - promtail (one per node)
# - minio (if enabled)

# Check services
kubectl get svc -n monitoring

# Check persistent volumes
kubectl get pvc -n monitoring
Configuration
Configure Loki as a Grafana Data Source
Update your Prometheus stack to add Loki as a data source:
Create prometheus-update-values.yaml:
grafana:
  additionalDataSources:
    - name: Loki
      type: loki
      uid: loki
      url: http://loki-gateway.monitoring.svc.cluster.local
      access: proxy
      editable: true
      isDefault: false
      jsonData:
        maxLines: 1000
Update the installation:
helm upgrade kube-prom-stack prometheus-community/kube-prometheus-stack \
  --namespace monitoring \
  -f prometheus-values.yaml \
  -f prometheus-update-values.yaml
Configure AlertManager
Create an AlertManager configuration file:
# alertmanager-config.yaml
alertmanager:
  config:
    global:
      resolve_timeout: 5m
      slack_api_url: 'https://hooks.slack.com/services/YOUR/SLACK/WEBHOOK'

    route:
      group_by: ['alertname', 'cluster', 'service']
      group_wait: 10s
      group_interval: 10s
      repeat_interval: 12h
      receiver: 'slack-notifications'
      routes:
        - match:
            severity: critical
          receiver: 'slack-critical'
        - match:
            severity: warning
          receiver: 'slack-warnings'

    receivers:
      - name: 'slack-notifications'
        slack_configs:
          - channel: '#monitoring'
            title: 'Kubernetes Alert'
            text: '{{ range .Alerts }}{{ .Annotations.summary }}\n{{ end }}'

      - name: 'slack-critical'
        slack_configs:
          - channel: '#critical-alerts'
            title: 'CRITICAL: Kubernetes Alert'
            text: '{{ range .Alerts }}{{ .Annotations.summary }}\n{{ end }}'

      - name: 'slack-warnings'
        slack_configs:
          - channel: '#warnings'
            title: 'Warning: Kubernetes Alert'
            text: '{{ range .Alerts }}{{ .Annotations.summary }}\n{{ end }}'
Apply the configuration:
helm upgrade kube-prom-stack prometheus-community/kube-prometheus-stack \
  --namespace monitoring \
  -f prometheus-values.yaml \
  -f alertmanager-config.yaml
Create Custom PrometheusRules
Example alert rule:
apiVersion: monitoring.coreos.com/v1
kind: PrometheusRule
metadata:
  name: custom-alerts
  namespace: monitoring
  labels:
    release: kube-prom-stack
spec:
  groups:
    - name: custom.rules
      interval: 30s
      rules:
        - alert: HighPodMemory
          expr: |
            sum(container_memory_usage_bytes{pod!=""}) by (pod, namespace)
            / sum(container_spec_memory_limit_bytes{pod!=""}) by (pod, namespace)
            > 0.9
          for: 5m
          labels:
            severity: warning
          annotations:
            summary: "Pod {{ $labels.namespace }}/{{ $labels.pod }} memory usage is above 90%"
            description: "Pod memory usage is {{ $value | humanizePercentage }}"
Apply the rule:
kubectl apply -f custom-alerts.yaml
Create ServiceMonitor for Custom Applications
Example ServiceMonitor:
apiVersion: monitoring.coreos.com/v1
kind: ServiceMonitor
metadata:
  name: my-app-monitor
  namespace: default
  labels:
    release: kube-prom-stack
spec:
  selector:
    matchLabels:
      app: my-application
  endpoints:
    - port: metrics
      interval: 30s
      path: /metrics
Accessing the Stack
Public Access
It is important to be aware when exposing cluster services of the traffic management available. Examples below illustrate local port forwarding access.
Access Grafana Port Forwarding (Quick Access)
kubectl port-forward -n monitoring svc/kube-prom-stack-grafana 3000:80
Access at: http://localhost:3000
Default credentials:
- Username:
admin - Password: Check the secret or use what you set in values
Get password:
kubectl get secret -n monitoring kube-prom-stack-grafana \
  -o jsonpath="{.data.admin-password}" | base64 --decode ; echo
Access Prometheus
kubectl port-forward -n monitoring svc/kube-prom-stack-prometheus 9090:9090
Access at: http://localhost:9090
Access AlertManager
kubectl port-forward -n monitoring svc/kube-prom-stack-alertmanager 9093:9093
Access at: http://localhost:9093